Read about the new
James J. Kaput Center
for Research and Innovation in Mathematics Education,
at the University of Massachusetts Dartmouth.
Download the materials used in this experiment.
Download other SMW software.
Integrating Teacher Professional Development, Curriculum, and Software
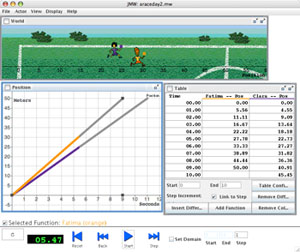
The SimCalc approach integrates teacher professional development, curriculum and software called SimCalc MathWorlds® (SMW). In the Scaling Up Simcalc project, teachers used the application for desktop computers.
Dr. James J. Kaput, Ph.D. of the University of Massachusetts, Dartmouth designed the SimCalc program in the late 1980s to achieve his vision of "democratizing access to the mathematics of change," i.e., making concepts of proportionality, linearity and rates of change accessible to middle school students of all cultural and demographic backgrounds. Through use of interactive software, the SimCalc program advances student learning of proportionality beyond the traditionally taught cross-multiplication procedure.
The key SMW features used in this experiment allow students to manipulate graphs and algebraic expressions that describe linear and piecewise linear motion. Students can modify graphed functions directly, by dragging handles on key parts of the graph with the computer pointing device (e.g. by clicking the mouse on marked places on the function, students can change its slope or its range) Students can also edit algebraic expressions with the mouse and keyboard .Using a piecewise linear function, students can describe familiar motion and financial scenarios with changing rates. For example, a student could model a situation in which an athlete runs a 50 yard dash, stops to catch her breath, and then walks to cool down. Alternatively, a student could model a cell phone plan which charges a fixed fee for the first 1000 minutes, but then charges $0.10 for each subsequent minute. Importantly, after editing a graph or algebraic expression, the student can execute the mathematics to see a simulated motion corresponding to the interpretation of the graph or algebraic expression as describing changes in position over time. To execute the mathematical descriptions, students press a VCR-like "play" button. Importantly, all mathematical representations are linked such that changes in one representation are immediately reflected in the other representations of the same function. For example, changing the slope in a graph results in a corresponding change to the numeric rate in the corresponding algebraic expression and vice versa. Algebraic expressions, graphs, tables and motions are all interlinked in this fashion.
Additional features of the software not used in this experiment allow students to work with velocity or acceleration graphs in addition to position graphs. Further, in the newest versions of the software the students and teacher are linked by a network.